


Janhvi
01 — About me
Aspiring Data Analyst equipped with a strong foundational knowledge of statistical analysis and data visualization. Proficient in SQL, Python, and Tableau, with hands-on experience building predictive models and interactive dashboards through academic and personal projects.
Download Resume
— Academic Journey
— What I care about
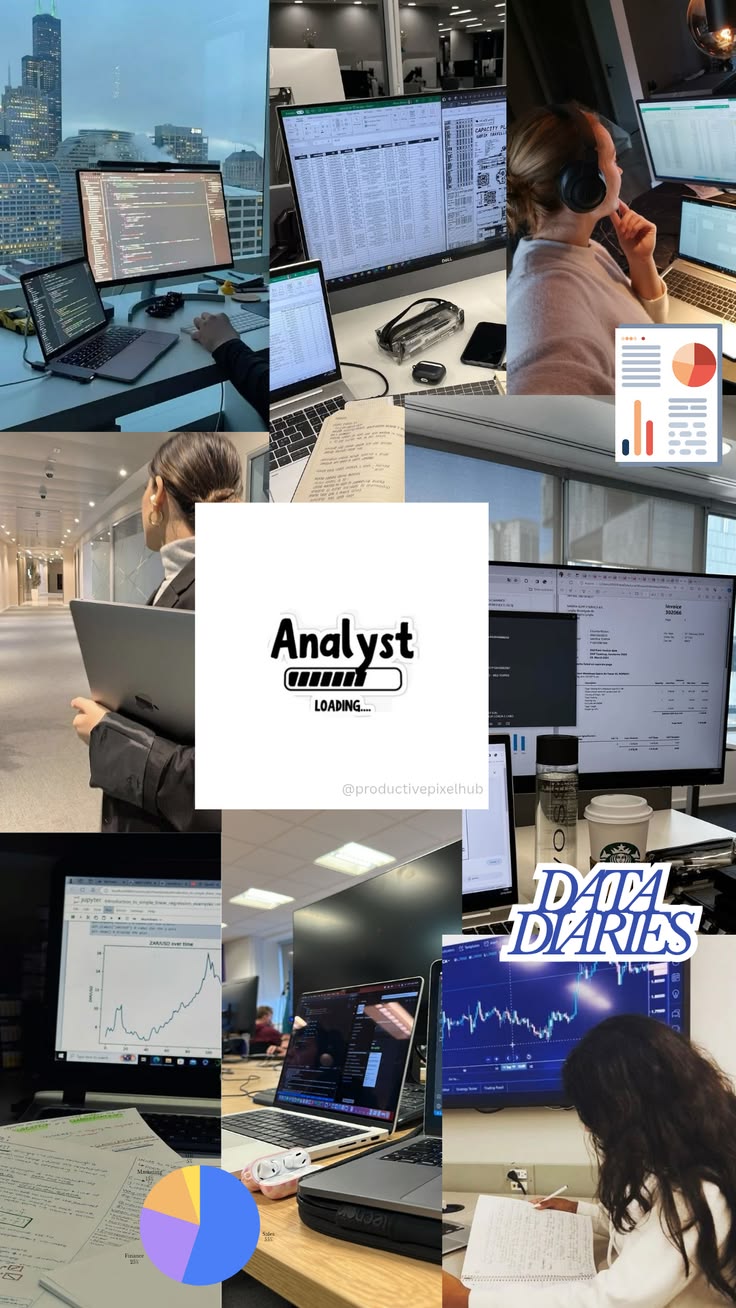
— A Peek At My Life


"Focused on curiosity and continuous learning"
— Janhvi Chaurasia
02 — Selected Work
03 — What I Do
Transforming raw, messy datasets into clear and actionable insights using Python and SQL. I ask the right questions, clean the noise, and surface patterns that drive smarter decisions.
Building interactive dashboards and visual narratives with Tableau and Python that make complex data instantly understandable — from executive summaries to deep-dive analytical reports.
Designing and evaluating ML models to forecast trends and support data-driven decisions — from regression baselines to end-to-end classification pipelines using Scikit-learn.
04 — Get In Touch
